Answers
Find out how much traffic was generated by each tracking code
To determine how much traffic was generated by tracking links that were shared via your social media and other campaigns, follow these steps:
- Log in to your Purplepass event organizer dashboard
- Click My Events is the top navigation bar if not already on the page

-
Find the event you want to view statistics and information on and click the Stats tab to the right of the event

-
Once on the stats page, click the Marketing tab
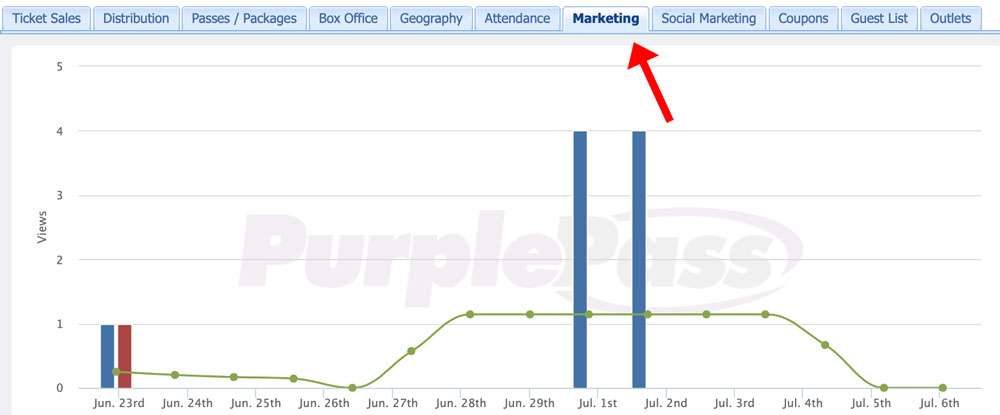
A graph will appear with a spreadsheet below it on the statistics/marketing tab. On the graph at the bottom of the page is information collected by each tracking code or shortcut code shared online.
You can view information about each view, unique view, revenue, method of sale and more helpful stats by clicking the plus icon to the left of each listed date.
Views: each time a customer clicks a link
Unique views: these are counted once for each individual that clicks the link, regardless of the total amount of times they click it.
You can also see how many orders they placed and how many tickets they purchased, as well as the total sales or refunds processed.